Top Traits for Data Analytics Tools

Business Record Staff Jun 7, 2017 | 6:00 am
2 min read time
573 wordsBusiness Insights Blog, The Internet of ThingsBY DENNY FISHER, Chief strategist, ACS
Better data leads to better decision-making when it comes to business.
That’s why it’s important to have the most accurate data possible when trying to make those decisions.
Using a data analytics or business intelligence tool will help you sort through millions of pieces of information that are collected through the Internet of Things to decide and then analyze what’s most critical for your business.
“You can drown in the amount of data that’s coming at you if it’s not organized,” says Eric Hoefing, manager, application development for ACS.
The volume of data from the IoT will be comparable to an elevation map: The top-lying data will be a high-level overview, without much detail, but as you dig down, investigating a specific area, you’ll see a more granular view that will provide more detail and allow you to understand the nuances of the data.
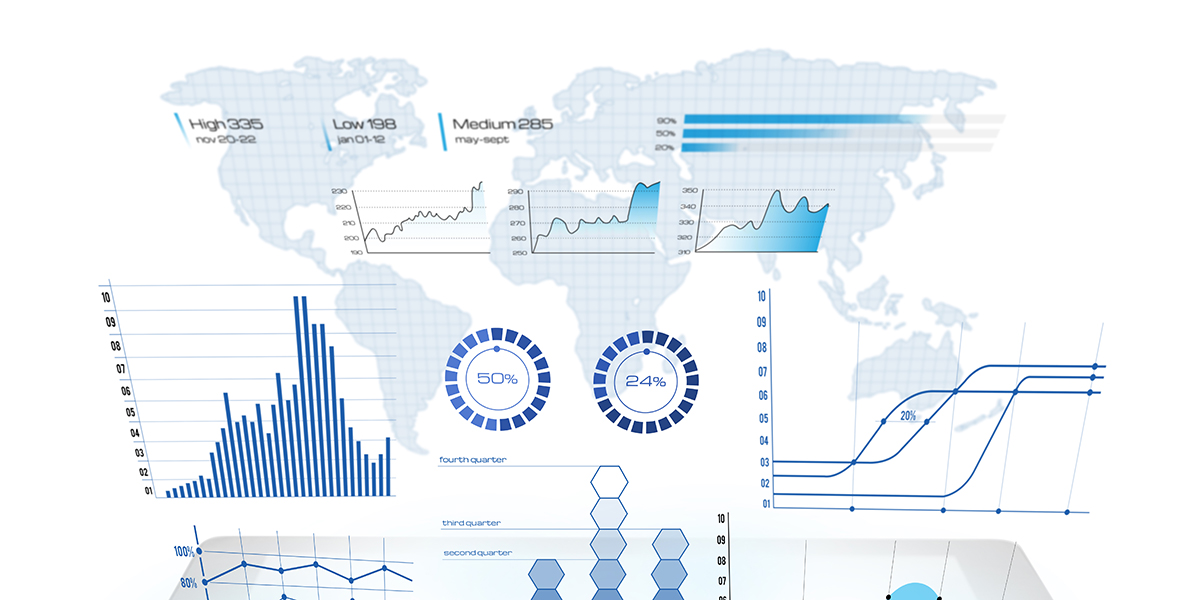
An analytics tool can help data become less of a high-range-view hodgepodge of numbers and more of a visual picture of the low-lying data points you want. For example, an analytics tool such as Tableau will allow you to more effectively use data from a database server or a program such as Microsoft Excel to visually evaluate the information and bring to light trends and anomalies. Gone are the days of static graphs and pie charts. Today’s data visualizations flex and breath as you investigate the information.
Now, you can quickly measure data into detailed categories and place that data into visual charts, diagrams and groupings that will give you specific information down to the year, month, week or even day in which something happened; or the region, state or city in which a sale took place. Businesses can quickly see where their sales are happening and more quickly understand why. They can click on the “sales” category, and information is loaded into a bar chart or another visual chart that gives them immediate answers.
That information becomes even more critical when determining trends and using the data to foresee potential problems or issues that could arise for the business. For example, if data shows a company’s workload decreases during certain months of the year, the company can reallocate resources to properly accommodate the change in workload.
“It allows you to make a change faster,” Hoefing says, “rather than waiting for the information and missing the decision window.”
A business owner can feel more confident making decisions because he or she is backed with data, making a decision that is based on educated calculations rather than just speculation.
The data also could produce information that is irrelevant to the business. The analytics tool will help weed out this data, so business leaders aren’t wasting time debating irrelevant things.
A good analytics tool will:
- Be easy for your business to use.
- Break down data in a visual form in multiple ways beyond a pie chart.
- Easily connect to multiple data sources.
- Provide a support community of users.
Now that you’ve determined an analytics tool will help you filter data, determine which are most important to your business, and how to you can use that information, you need to know which servers can best support your analytics tool to ensure it’s always there to help you make the best business decisions. Next month, we’ll explain how to choose a server for your critical applications and data processing.
 |
Denny Fisher, Chief Strategist View Bio 515-223-0078 contact@acsltd.com acsltd.com/br |


