Market Vibe
Each year, the Book of Lists provides a resource for business leaders to refer to as they look for new partnerships, colleagues and data points that can help their organizations. The Market Vibe section is compiled to give a snapshot of the region. The data shown here is meant to help you better understand Greater Des Moines’ business ecosystem. We sought to answer questions pertinent to economic development and workforce support. How does current downtown foot traffic compare to before the pandemic? What trends about air travel are projected? What is the average cost of rent compared to wages in the region? And more. These data points are continuously fluctuating. Throughout, we offer some context about the important information to know about these numbers.
– Emily Barske Wood, Business Record special projects editor
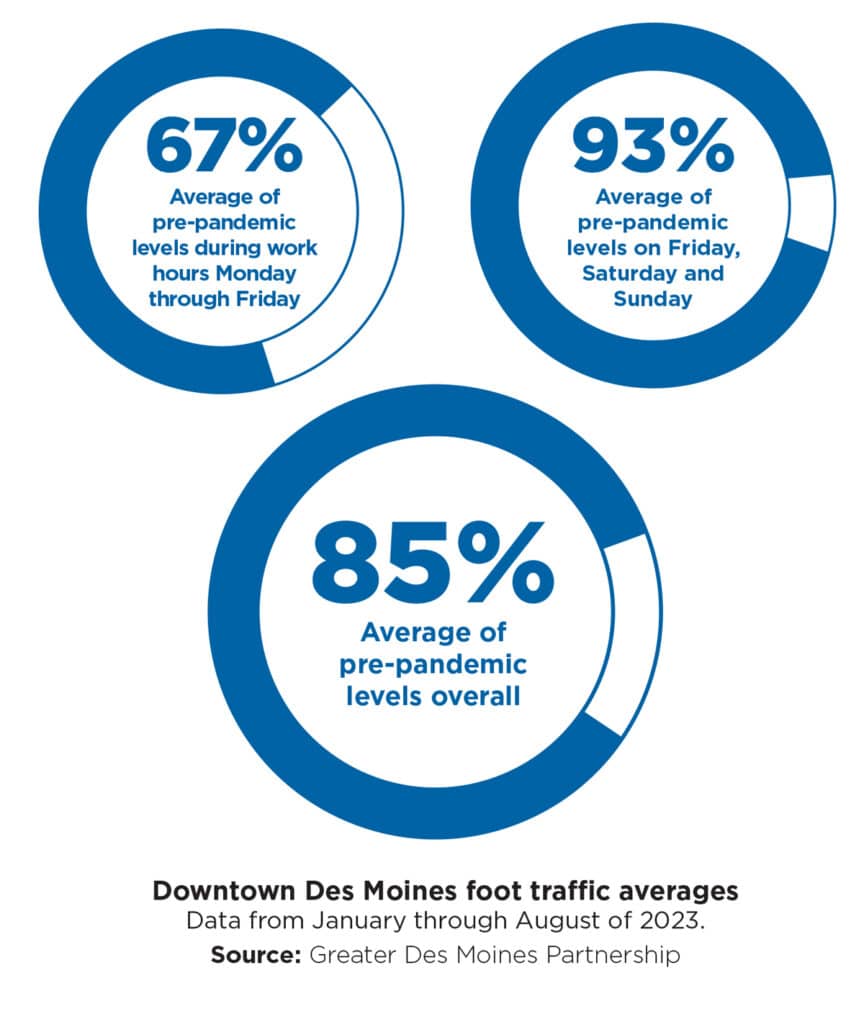
Downtown foot traffic steadily rising
As of August 2023, foot traffic in downtown Des Moines is at nearly 85% of pre-pandemic levels and nearly 12% over 2022. Workday foot traffic is up an average of nearly 36% year over year from the beginning of the year through August compared to 2022. This includes an average of nearly 38% growth on core days of Tuesday through Thursday. In early August 2023, Principal Financial Group told its employees that most would be required to begin working in the office at least three days a week starting in November. The pandemic, which sent office workers to remote locations to work, hit the U.S. office market hard. Some companies have decreased the amount of space they lease because workers haven’t returned to the office. Leasing activity for office space has declined, and the value of office properties has fallen because of the large amounts of vacant space on the market. Hardest hit have been large metropolitan areas, where up to one-third of office space is vacant. According to Avison Young’s 2023 first-quarter market report, 22% of all office space in the U.S. was available for direct lease or sublease. Des Moines’ central business district has 1.145 million square feet of office space, 17.5% of which was vacant in the second quarter of 2023, a CBRE Inc. market report showed. Decisions to bring more workers back, like the one made by Principal leaders, were expected to bolster downtown’s weekday foot traffic and boost economic activity.
Reporting contributed from Business Record senior staff writers Kathy Bolten and Michael Crumb.
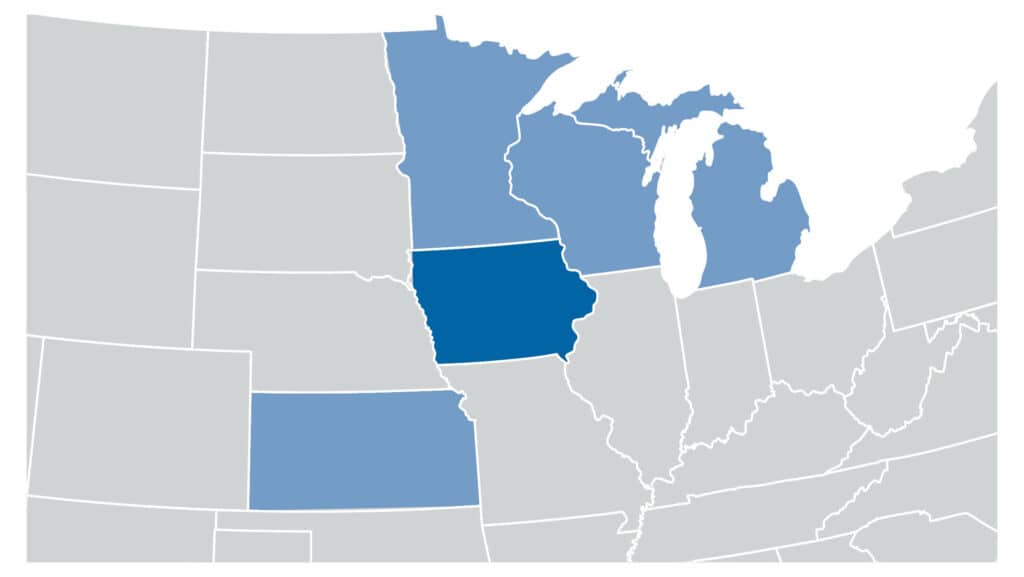
Iowa ranks No. 1 in using robotics in manufacturing
New research from Stanford University shows where in the country robots are used in manufacturing the most, and Iowa comes in at No. 1, with four other Midwest states in the top five. The four other states in the top five are Michigan, Kansas, Wisconsin and Minnesota. “The concentration of robot hubs is a function of several different things, such as the type of manufacturing these firms do, the education of the workforce, the size of the establishments, but it’s also sort of an unexplained dark matter, and that seems important as well,” Erik Brynjolfsson, director of the Stanford Digital Economy Lab and senior fellow at the Stanford Institute for Human-Centered AI, said in reporting about the findings. “Something about these environments makes it so that companies are more likely to use robots. A big part of future research will be to find out why that is.” Manufacturing campuses that use robots are relatively capital intensive (particularly in other types of capital), hire disproportionally more production workers and pay lower average wages than their non-robot-using counterparts, according to the National Bureau of Economic Research. “At face value, these results suggest that robots are mostly complements to production workers, not substitutes for them,” researchers said in a March 2023 paper.
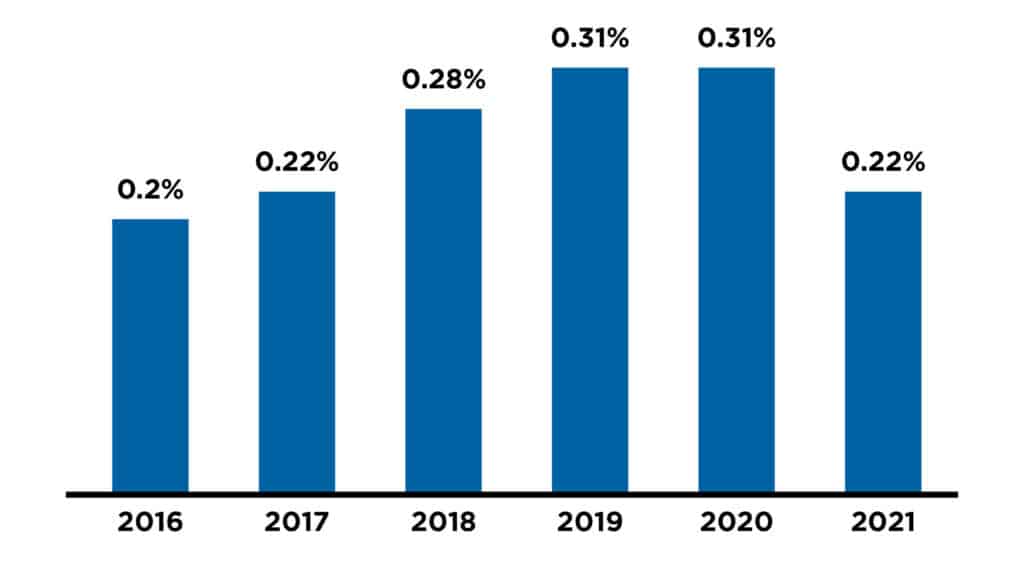
Rate of new entrepreneurs in Iowa
The rate of new entrepreneurs measures the percentage of the population that starts a business in Iowa. This indicator captures all new business owners, including those who own incorporated or unincorporated businesses, and those who are employers or non-employers. This is the most recent data made available by the Iowa Innovation Dashboard. The rate in 2019 and 2020 was the highest it has been since 2005. This rate is calculated by the Kauffman Foundation using microdata from the Current Population Survey, a monthly survey of the U.S. Bureau of the Census and Bureau of Labor Statistics.
Source: Iowa Innovation Dashboard
Major events hosted in 2022 and 2023
- Farm Progress Show
- NCAA Division I Men’s Basketball Tournament first and second rounds
- Dew Tour
- State Games of America
- Certified Piedmontese Beef Ironman 70.3 Des Moines
- National Veterans Golden Age Games
- American Quilter’s Society – AQS QuiltWeek
- Kennedy Center American College Theater Festival - Region 5 Festival
- Midwest Nursing Research Society Annual Conference
- American Association of Meat Processors Annual 2022 Convention
- Military Vehicle Preservation Association Annual Convention
- Association of Medical Illustrators Annual Meeting
- Nursing Organizations Alliance Fall Summit
- 2023 NAIA Men’s Volleyball National Championship
- National Association of Attorneys General – Presidential Summit
Source: Catch Des Moines
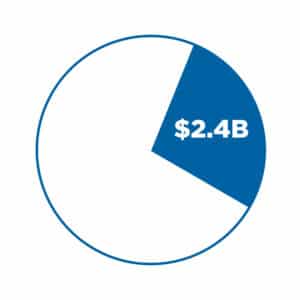
Polk and Dallas counties received more than $2.4 billion of the $9.4 billion in statewide spending in 2021, according to the Iowa Economic Development “Iowa tourism Economic Impact Report.” More than 16,000 jobs are supported by this spending.
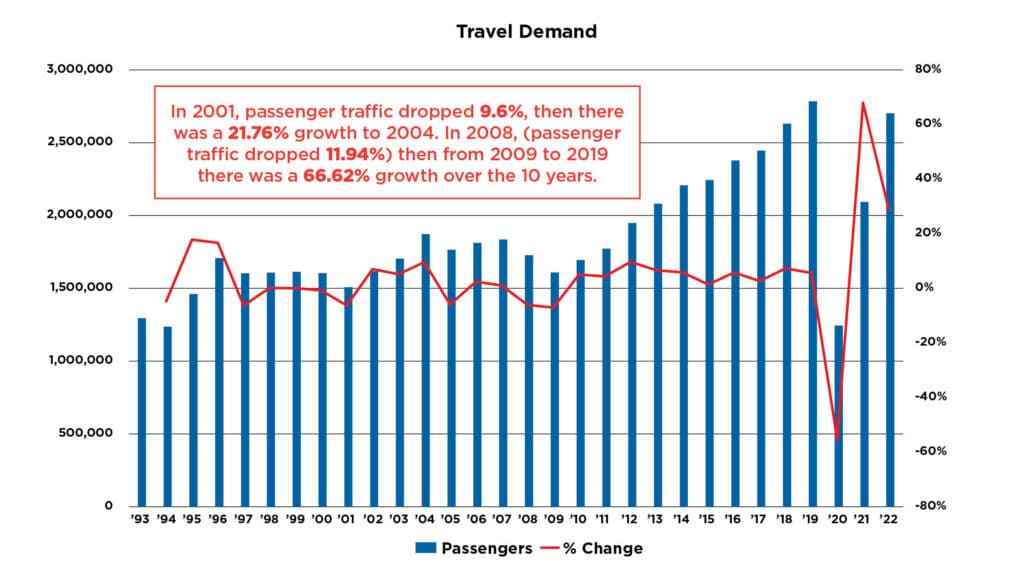
Air travel demand got pent up during an economic downturn, but that lead to significant recovery growth trends. To date, DSM is showing strong signs of recovery, with 2023 outpacing 2019 record passenger throughput numbers before the downturn caused by the coronavirus pandemic. As of September 2023, there had been 2,313,087 passengers through the calendar year, which was on track to surpass the 2.9 million passengers from 2019.
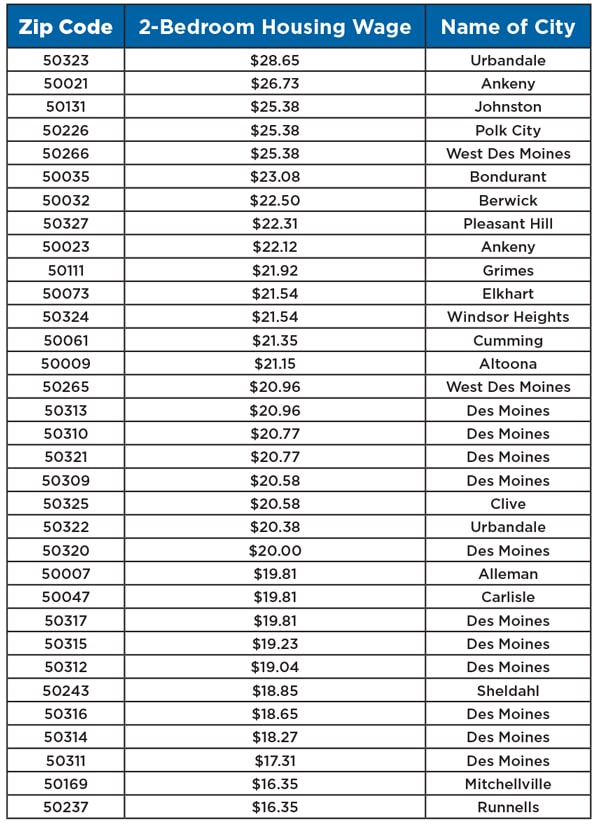
Rent compared to wages by zip code
Among the most pressing challenges for communities and employers is ensuring that affordable housing is available for the Greater Des Moines workforce. So exactly how much does an employee have to earn to afford to live in the area? The answer depends on which zip code they reside in. The two-bedroom housing wage is an estimate of the hourly wage a person would need to earn to afford a two-bedroom apartment in that area, assuming they work 40 hours a week for 52 weeks of the year.
Data note: The dollar amount shown for each zip code is the two-bedroom housing wage, which is only available within metropolitan areas. Zip code-level housing wages are based on the U.S. Department of Housing and Urban Development’s small area fair market rents for zip code tabulation areas from the U.S. Census Bureau, which differ slightly from U.S. Postal Service zip codes.
