Predictable Success vs. Predictable Disappointment

Business Record Staff Nov 1, 2018 | 11:00 am
4 min read time
867 wordsBusiness Insights Blog, FinanceBY KENT KRAMER, CFP®, AIF®, Chief Investment Officer, Foster Group
Wouldn’t it be great if you could attain predictable success in your investment portfolio, the kind of success that was understandable, systematic, and repeatable?
In his book “Predictable Success,” consultant Les McKeown describes how organizations in pursuit of long-term success develop repeatable, systematic, “predictably successful” approaches to their operations.
Investors would do well to pursue the same goal. What are the systematic approaches to investing that lead to more predictably successful outcomes, and how do I avoid practices that lead to predictable disappointments?
Avoiding predictable disappointments
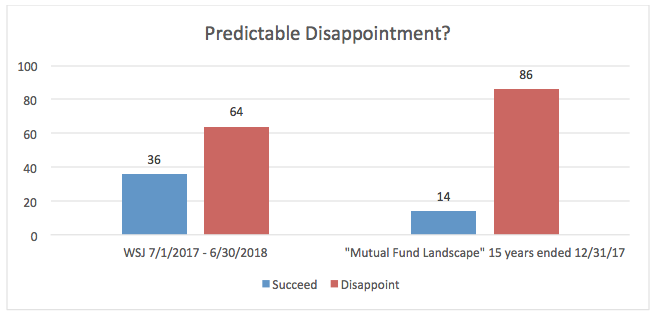
In the world of investing, a predictable disappointment could be characterized as an approach that has a relatively high probability of underperforming some benchmark or goal. In the Sept. 29, 2018, Wall Street Journal, the article “Stock Pickers Struggle to Beat Index Funds Once Again”1reveals that only 36% of actively managed funds outperformed peer group index funds and ETFs for the 12 months ended June 30, 2018. Active management strategies often are characterized by higher turnover (trading), higher fees and lower levels of diversification.
The likelihood of underperformance by fund managers appears to rise as the measuring period lengthens. Dimensional Fund Advisors publishes a “Mutual Fund Landscape”2study each year. The results through Dec. 31, 2017, show that only 14% of equity funds survived and beat their Morningstar category index over the previous 15 years. Both the Wall Street Journal article and the Dimensional study reveal higher probabilities of disappointment than success. Traditional active fund management has been predictably disappointing.

Predictable success
If an investor wants to pursue a long-term higher rate of return for their invested dollars, they likely will choose stocks over bonds. There is ample research supporting a market premium (e.g., U.S. stocks outperforming U.S. Treasury bills). This premium is not positive every year, but over 10-year calendar periods since 1926, it has been positive 85% of the time (68 of 80 years), with an average premium of 8.27%3. While not a guarantee of success, it is reasonable to predict that over most 10-year periods, U.S. stocks should outperform one-month U.S. Treasury bills. An investor choosing a low-cost index fund has a reasonably high probability of achieving a market-like return and having a predictably successful result, capturing a very high percentage of the overall market return along with the market premium.
Another systematic investment practice that leads to predictable success is long-term diversification. While the U.S. stock market handily has outperformed international stocks since the Great Financial Crisis of 2007-2009, investors with longer memories may recall the so-called “lost decade” running from 2000 to 2009 when U.S. stocks4had a negative return over the entire 10-year period (-9.10% total return). International stocks5in that same decade produced a positive return (35.90% total return), as did real estate6(175.59% total return). Investors who held a diversified portfolio of 50% U.S. stocks, 25% foreign stocks and 25% real estate had a much higher probability of positive returns (39.95% total return) in the “lost decade” of the 2000s and would have continued that positive return probability (156.85% total return) in the nine years since 2009. Consistent, systematic diversification can be an effective means to predictable success for long-term investors.
Avoiding predictable disappointments and implementing systematic, academically supported approaches to predictable success is attainable and can provide rewarding long-term results for investors. The evidence is there for those who are looking for it.
| January 1, 2000 through December 31, 2009 | January 1 2010 through August 31, 2018 | January 1, 2000 through August 31, 2018 | September 1, 2017 through August 31, 2018 | |
| S&P 5004 | -9.10% | 211.88% | 183.52% | 19.66% |
| Foreign Stocks5 | 35.90% | 56.30% | 112.42% | 3.67% |
| Real Estate (REITS)6 | 175.59% | 167.24% | 636.50% | 7.80% |
| Portfolio* (50% S&P 500, 25% Foreign Stocks, 25% REITS) | 39.95% | 156.85% | 257.93% | 12.74% |
All returns are stated as total (non-annualized) returns for the periods.
- https://www.wsj.com/articles/stock-pickers-struggle-to-beat-index-funds-once-again
- https://us.dimensional.com/perspectives/mutual-fund-landscape-2018
- Information provided by Dimensional Fund Advisors LP.In US dollars. The equity premium is the Fama/French Total US Market Index minus one-month US Treasury Bills. Fama/French indices provided by Ken French. The information shown here is derived from such indices. One-Month Treasury Bills is the IA SBBI US 30 Day TBill TR USD, provided by Ibbotson Associates via Morningstar Direct.
- US Stocks: S&P 500 TR USD
- Foreign Stocks: MSCI ACWI Ex USA NR USD
- US REITS: DJ US Select REIT TR USD
*Asset class returns cited from respective index data supplied by Morningstar.
**PAST PERFORMANCE IS NO GUARANTEE OF FUTURE RESULTS.
Please see specific disclaimer on our website: https://www.fostergrp.com/indexed-fund-disclosure/. All investment strategies have the potential for profit or loss. Asset allocation and diversification do not ensure or guarantee better performance and cannot eliminate the risk of investment losses. There are no assurances that an investor’s portfolio will match or outperform any particular benchmark.
PLEASE NOTE LIMITATIONS: Please see Important Disclosure Information and the limitations of any ranking/recognitions, at www.fostergrp.com/info-disclosure. The above discussion should be viewed in its entirety. The use of any portion thereof without reference to the remainder could result in a loss of context. Foster Group cannot be responsible for any resulting discrepancy. A copy of our current written disclosure statement as set forth on Part 2A of Form ADV is available at www.adviserinfo.sec.gov
 | Kent Kramer View Bio |


